Insights
Last updated on • Disponible en Français
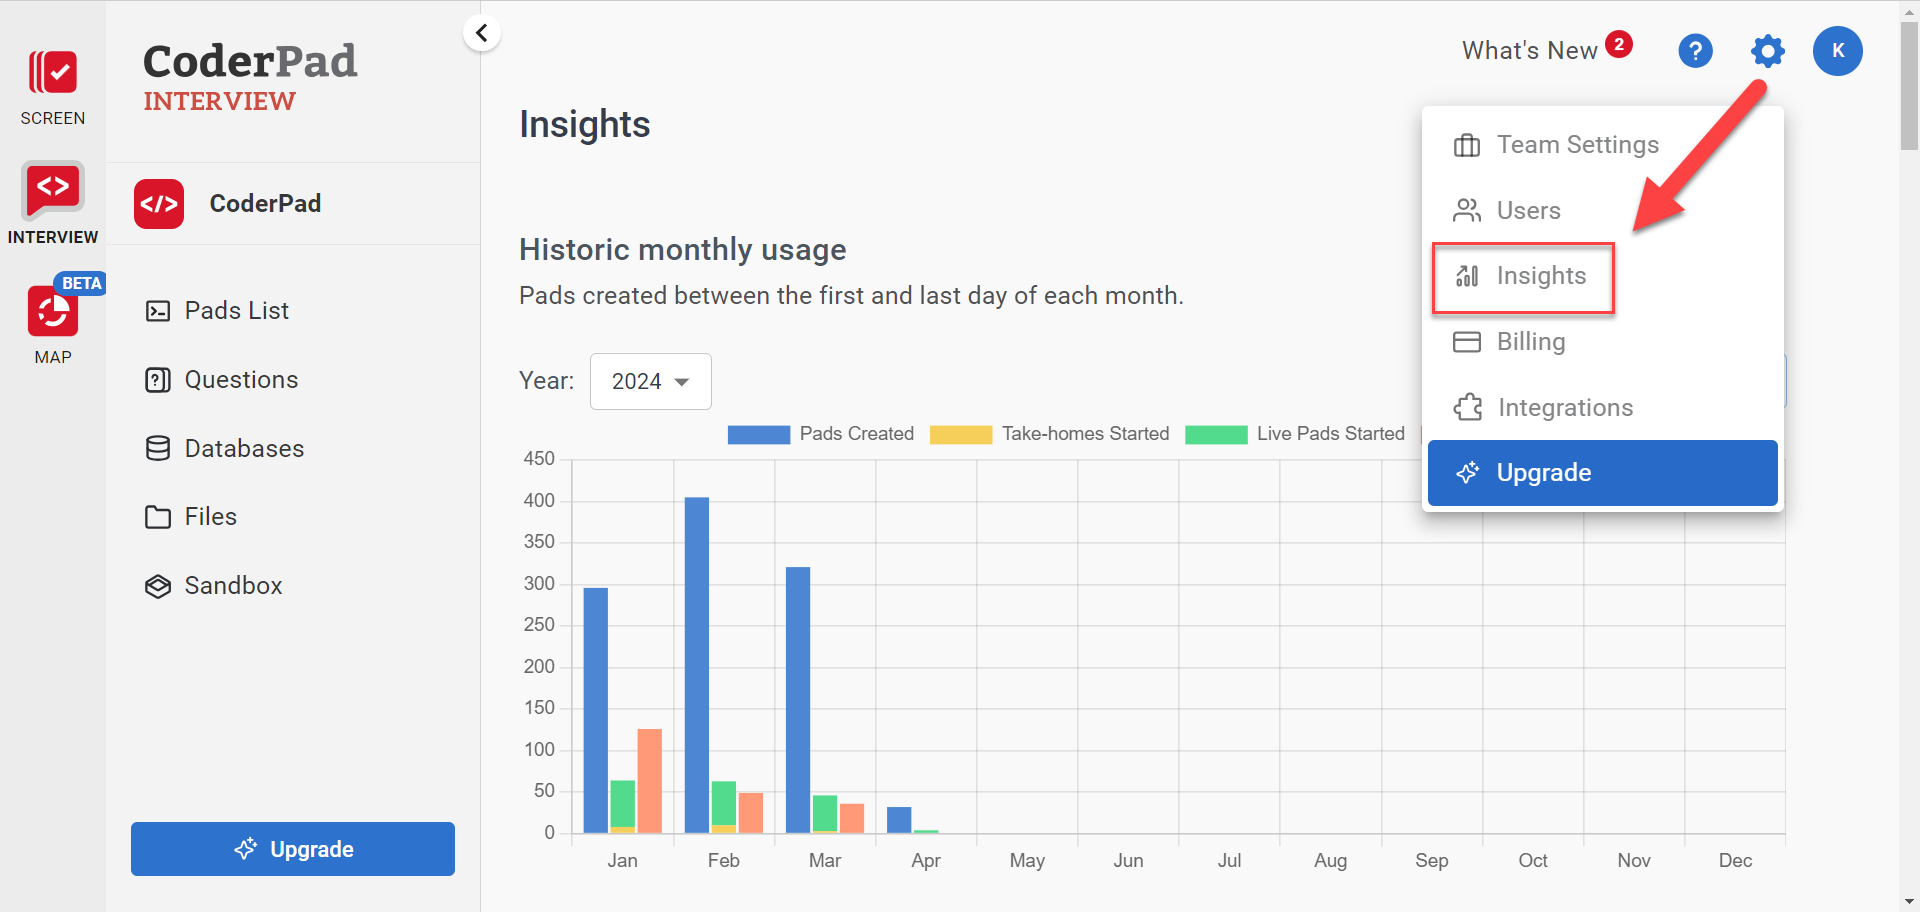
Insights will let you see all your account’s statistics from the time the account was created to the present. To access this page, click on the settings gear icon at the top right of the screen, and then select Insights from the drop-down menu:
You’ll be able to see the following statistics:
Usage reporting
The graph shows your pads and tests usage for the selected year.
You can export this information in a CSV file by clicking the export button in the top right corner of the chart area and selecting one of two options:
- The Monthly usage summary lists monthly totals during the selected year.
- The Detailed report of all pads and tests itemizes each pad and test from the selected year.

After you select the report type, the report will be generated and emailed to you.
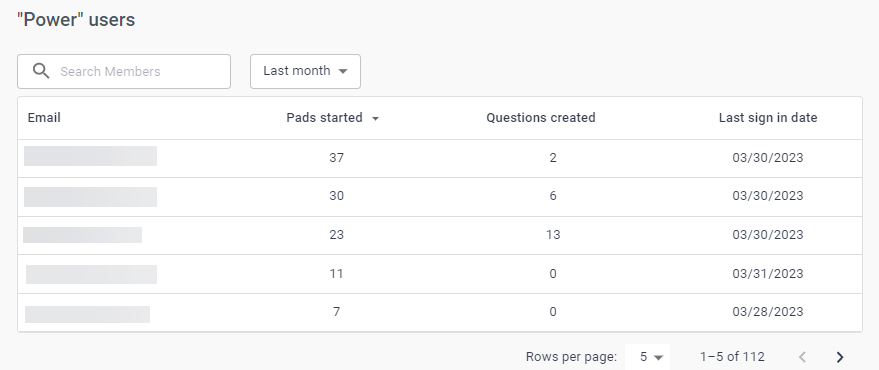
“Power” users
Here you can see which users are creating the most pads or questions in a selected time period by clicking on the Pads started column or Questions created columns, respectively. You can also sort alphabetically by their email address.
Usage by member
Here you can see the number of pads created in the last 30 days, the number of total pads created, and the last sign in date for any given user. You can sort by email alphabetically by clicking on the Email column, or numerically by Pads created in the last 30 days and Pads created lifetime by clicking on those respective columns.
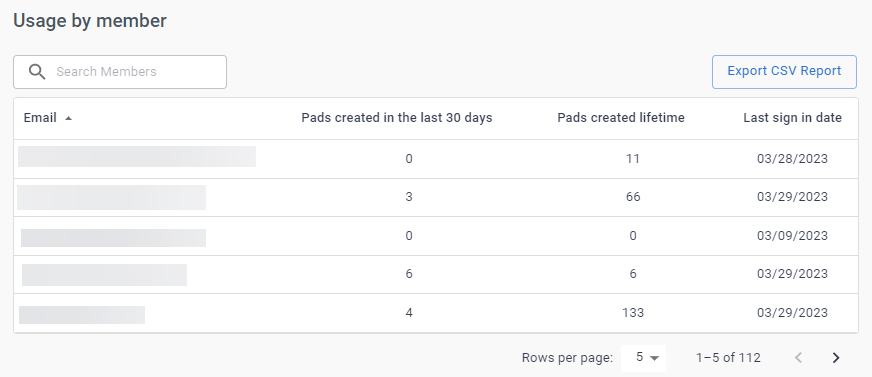
You can export this information as a CSV file by clicking the Export CSV Report button in the top right corner of the table area.
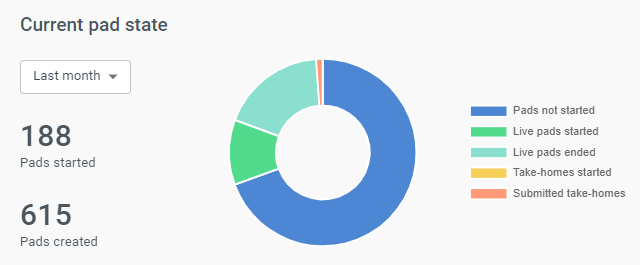
Current pad state
Shows you the current statuses of all the pads in your account for a given time period. In addition to Pads started and Pads created, you’ll also see data for:
- Pads not started
- Live pads started
- Live pads ended
- Take-homes started
- Submitted take-homes
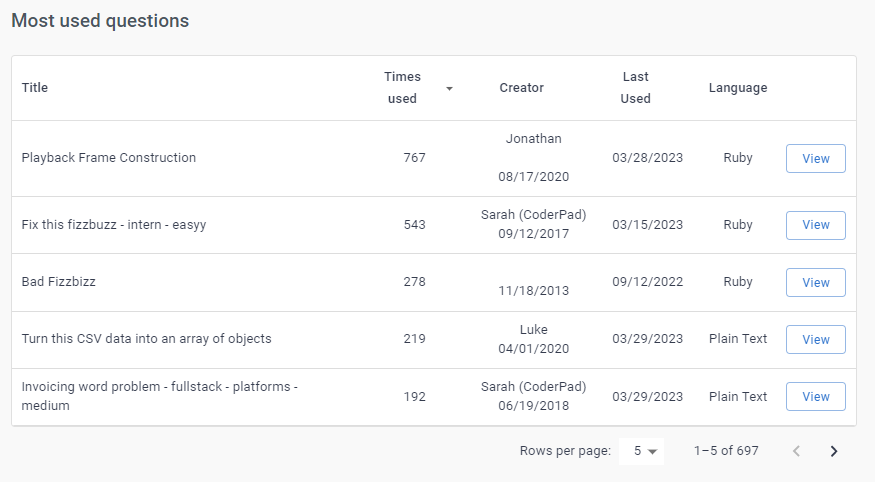
Most used questions
See which questions are the most used in your organization. You can sort by Title, the number of Times used, the Creator, and when the question was Last used by clicking on the respective column. You can also view the question in the Question Bank by clicking on the View button at the end of the row.
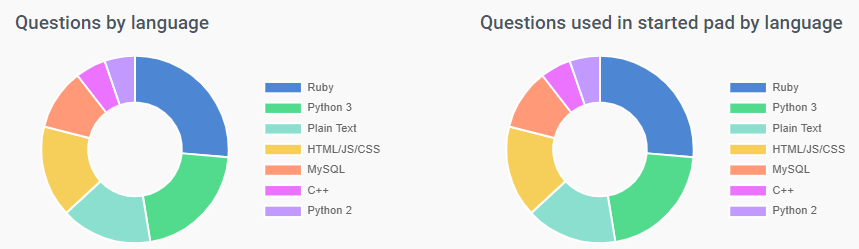
Questions by language & Questions used in started pad by language
Questions by language shows you a breakdown of all the languages per question created. Questions used in started pad by language shows you a breakdown of all languages of questions actually used in a started pad.
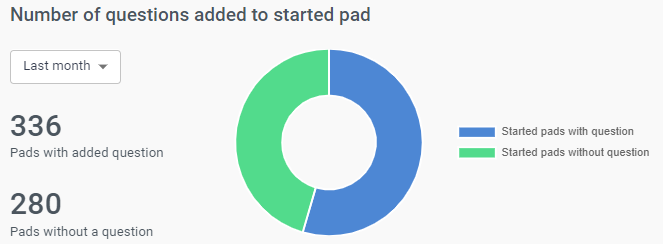
Number of questions added to a started pad
Here you can see the breakdown between pads that have questions attached to them and pads without questions for a selected time period.
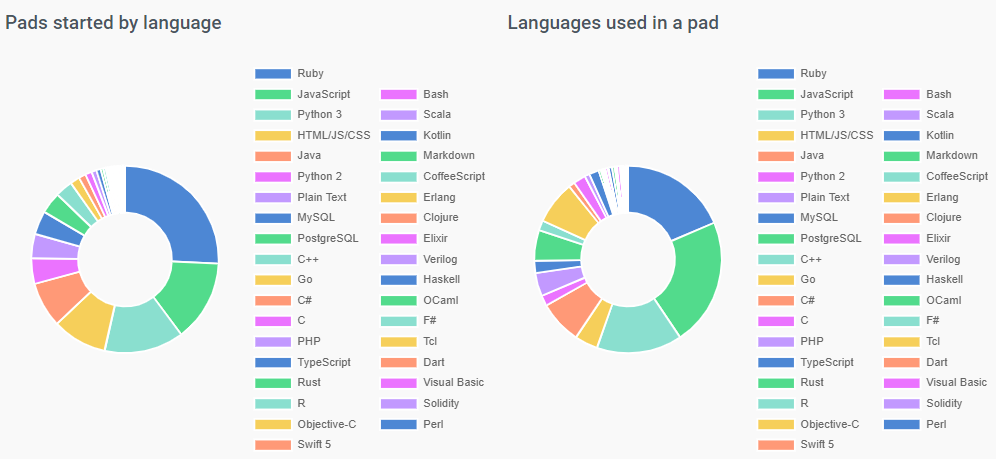
Pads started by language & Languages used in a pad
Pads started by language shows the initial language pads are created with. Languages used in a pad show all languages that are used in the pads.