Data Science Interview Questions for Developers
Use our expert-created questions to interview and hire the most qualified data science developers for your organization.
Data Science
The ever-in-demand data scientist possesses a deep understanding of data analysis and machine learning methodologies, making them a pivotal figure in almost every project team.
According to the CoderPad 2024 Developer survey, data science developers are the ninth-most in-demand job role technical recruiters are looking to fill.
The subsequent sections present a variety of hands-on coding challenges and interview questions designed to probe a candidate’s proficiency in data science during technical evaluations.
Furthermore, a collection of suggested best practices has been integrated to assist in a reliable assessment of candidates’ data science capabilities through your interview questions.
Table of Contents
Data science example questions
Question 1: Iris Exploratory Analysis
Context
The Iris dataset is a well known, heavily studied dataset hosted for public use by the UCI Machine Learning Repository.
The dataset includes three iris species with 50 samples each as well as some properties about each flower. One flower species is linearly separable from the other two, but the other two are not linearly separable from each other.
The columns in this dataset are:
idsepal_length_cmsepal_width_cmpetal_length_cmpetal_width_cmclassthis is the species of Iris
The sample CSV data looks like this:
sepal_length_cm,sepal_width_cm,petal_length_cm,petal_width_cm,class
5.1,3.5,1.4,0.2,Iris-setosa
7.0,3.2,4.7,1.4,Iris-versicolor
5.8,2.7,5.1,1.9,Iris-virginicaCode language: CSS (css)
Directions
Using any analysis method you choose, build either a classifier or produce a data visualization, that shows how the available data can be leveraged to predict the species of Iris.
Initial cell contents
Use this starter code to get started with accessing the Iris dataset in this pad. Feel free to use either Pandas or Native Python for your work.
You may install additional packages by using pip in this Notebook’s terminal.
import pandas as pd
import pprint

# Result as pandas data frame

result_df = pd.read_csv('iris.csv')

# Preview results output as a data frame

result_df.head()

# Result as pythonic list of dictionaries

result = result_df.where(pd.notnull(result_df), None).to_dict('records')

# Preview results output as a native list of dictionaries

pprint.pprint([record for record in result])Code language: Python (python)
Success criteria
At minimum, a candidate should be able to conduct a basic analysis showing that they explored the data and found a way to separate the unique characteristics of each flower from the other.
For example:
- Does one species of iris have longer petals than the other?
- Can the candidate pose questions about the dataset and explore the data for answers to those questions?
- Are the methods the candidate uses to explore the data reasonable? This question primarily requires some basic analysis and data visualization. If a candidate starts off with a more complex approach, there may be a missed opportunity for fast, early lessons from the data, aka “low-hanging fruit.”
- Can the candidate support any observations with plots?
- How does the candidate form inferences from the data and how well does that candidate apply statistics to defend their inferences?
Question 2: Forecasting Future Grocery Store Sales
Context
This example question uses one of the Getting Started competitions on Kaggle. The goal is to forecast future store sales for Corporación Favorita, a large Ecuadorian-based grocery retailer.
Data
train.csv: The training data, comprising time series of features store_nbr, family, and on promotion as well as the target salestest.csv: The test data, having the same features as the training data but starts after the ending date of train data and for 15 dates. One has to predict the target sales for the dates in this filestores.csv: This has some stores metadata including city, state, type, and cluster (grouping of similar stores)oil.csv: This has oil price data as Ecuador economy is susceptible to volatility of oil marketholidays_events.csv: This has data on holidays and events in Ecuador
Directions
- You are expected to do at least one completed time series analysis that predicts future sales.
- You are expected to show any data transformations and exploratory analysis.
- You have full flexibility to use the provided data as desired, but at minimum the date and sales numbers need to be used.
Initial cell contents
Please review the context and data overview in the Instructions panel in this pad to gain a basic understanding of the available data and this exercise.
# Following code loads useful libraries

# Useful for out of the box time series function libraries
install.packages('fpp3')
library(fpp3)

library(tsibble)
library(tsibbledata)
library(tidyverse)
library(ggplot2)Code language: R (r)
# Reading all the input datasets into memory
df_train <- read_csv("/home/coderpad/app/store sales files/train.csv",show_col_types = FALSE) %>%
mutate(store_nbr = as.factor(store_nbr))
df_test <- read_csv("/home/coderpad/app/store sales files/test.csv",show_col_types = FALSE) %>%
mutate(store_nbr = as.factor(store_nbr))
df_stores <- read_csv("/home/coderpad/app/store sales files/stores.csv",show_col_types = FALSE) %>%
mutate(store_nbr = as.factor(store_nbr))
df_transactions <- read_csv("/home/coderpad/app/store sales files/transactions.csv",show_col_types = FALSE)
df_oil <- read_csv("/home/coderpad/app/store sales files/oil.csv",show_col_types = FALSE)
df_holidays_events <- read_csv("/home/coderpad/app/store sales files/holidays_events.csv",show_col_types = FALSE)Code language: R (r)# Show training data
head(df_train)Code language: R (r)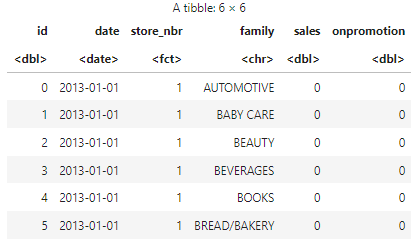
# Example visual of total daily sales

# Converting data frame into a tsbibble object
train_tsbl <- df_train %>%
  as_tsibble(key = c(store_nbr, family), index = date) %>%
  fill_gaps(.full = TRUE)

train_tsbl[is.na(train_tsbl)] <- 0

# aggregate data by stores
train_tsbl <- train_tsbl %>%
  aggregate_key(store_nbr, sales = sum(sales))

options(repr.plot.width = 18, repr.plot.height = 6)
train_tsbl %>%
  filter(is_aggregated(store_nbr)) %>%
  ggplot(aes(x = date, y = sales)) +
   geom_line(aes(group=1), colour="dark green") +
  labs(title = "Total Sales")Code language: R (r)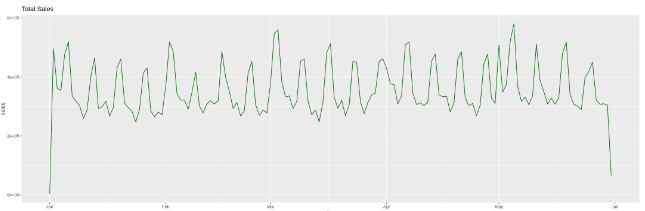
Success criteria
At minimum, a candidate should be able to conduct a basic time series analysis showing that they explored the data, transformed it appropriately for a time series analysis, considered a confounding factor like seasonality, and interpreted results in a reasonably accurate way.
For example:
- Does the candidate know to address auto-correlated data?
- Does the candidate explore the data to find any necessary transformations/clean up needed ahead of the analysis?
- Can the candidate identify seasonal patterns among store sales?
- Is the candidate able to justify their analysis approach and conclusions?
Data science skills to assess
Data science job roles
Junior data science interview question
Question: What is the difference between supervised and unsupervised learning?
Answer:
- Supervised Learning: In this type of learning, an algorithm is trained on labeled data. Meaning, both input and the corresponding desired output is provided. The main goal is to learn a mapping from inputs to outputs. Examples include regression and classification.
- Unsupervised Learning: Here, the algorithm is trained on data without explicit instructions on what to do. It finds patterns and relationships in the data on its own. Examples include clustering and association.
Question: Write a Python function that takes a list of numbers and returns its mean and sample standard deviation.
Answer:
import statistics

def mean_stddev(nums):
    return (
        statistics.mean(nums),
        statistics.stdev(nums)
    )Code language: JavaScript (javascript)
Question: What is cross-validation? Why is it useful?
Answer: Cross-validation is a technique used to assess how well a model will generalize to an independent dataset. It involves partitioning the original dataset into training and validation sets, training the model on the training set, and then evaluating it on the validation set. This process is typically repeated multiple times. It helps in understanding the model’s performance beyond the training data, reducing the chance of overfitting.
Question: Given a dataset data (a list of lists), write a Python function to transpose it.
Answer:
It is strongly advised to make sure all the sub-lists have the same number of elements before calling this function. Otherwise, some data will be lost during the transposition, due to the way the function zip works.
   def transpose(data):
       return [list(row) for row in zip(*data)]Code language: PHP (php)
Question: What is the difference between a parametric and a non-parametric algorithm?
Answer:
- Parametric Algorithm: Makes an assumption about the functional form of the data distribution or decision boundary. These models have a fixed number of parameters. Examples include linear regression and logistic regression.
- Non-parametric Algorithm: Does not make any assumptions about the data’s functional form. They can have a flexible number of parameters, which grow with the data. Examples include decision trees and kernel SVM.
Question: How would you calculate the median of a list of numbers?
Answer:
We can use the function statistics.median from the standard library:
from statistics import medianCode language: JavaScript (javascript)Question: What is the bias-variance trade-off?
Answer: The bias-variance trade-off refers to the balance between two sources of errors in models:
- Bias: The error due to overly simplistic assumptions in the learning algorithm. High bias can lead to the model missing relevant patterns, causing underfitting.
- Variance: The error due to the model’s complexity. High variance can lead the model to model the random noise in the training data, causing overfitting. Ideally, one wants to achieve a balance, where both bias and variance are minimized.
Question: Given a list of integers, use Python to count the frequency of each integer.
Answer:
from collections import Counter

def count_freq(nums):
    counter = Counter()
    counter.update(nums)
    return dict(counter)Code language: JavaScript (javascript)
Question: How would you handle missing data in a dataset?
Answer: Handling missing data is crucial for robust data analysis. Some common techniques include:
- Imputation: Replace missing values with statistical measures like mean, median, or mode.
- Deletion: Remove rows with missing values, especially if they’re a small subset of the data.
- Prediction Models: Use algorithms to predict and fill the missing values.
- Fill methods: For time series, forward fill or backward fill methods might be useful.
The choice of method often depends on the nature of the data and the problem being addressed.
Question: Write a Python function to split a dataset into training and test sets, with 80% for training and 20% for testing.
Answer:
   import random

   def train_test_split(data):
       random.shuffle(data)
       split_idx = int(0.8 * len(data))
       return data[:split_idx], data[split_idx:]Code language: JavaScript (javascript)
Intermediate data science interview question
Question: Describe regularization in machine learning. Why is it important?
Answer: Regularization adds a penalty to the complexity of a model, reducing the risk of overfitting. Common techniques include Elastic Net Regression, L1 (Lasso) regularization, and L2 (Ridge) regularization. By constraining the magnitude of model parameters, regularization ensures simpler models and helps in preventing overfitting, especially when the number of features is high.
Question: Implement a Python function for the sigmoid function, often used in logistic regression.
Answer:
   import math

   def sigmoid(x):
       return 1 / (1 + math.exp(-x))Code language: JavaScript (javascript)
Question: What are ensemble methods and why might they be useful?
Answer: Ensemble methods combine multiple models to improve overall performance. Common techniques include Bagging (e.g., Random Forests) and Boosting (e.g., Gradient Boosted Trees). By aggregating predictions from multiple models, ensemble methods can achieve lower variance and/or bias, leading to better generalization on unseen data.
Question: Given two equal-length lists of true values y_true and predicted values y_pred, write a Python function to compute the Mean Squared Error (MSE).
Answer:
This function exists in scikit-learn:
from sklearn.metrics import mean_squared_error.
But since it is not in the standard python library, it may sometimes be needed to recode it ourselves, which would look something like this:
 def mse(y_true, y_pred):
    n = len(y_true)
    squared_errors = [(y_t - y_p) ** 2 for y_t, y_p in zip(y_true, y_pred)]
    return sum(squared_errors) / nCode language: JavaScript (javascript)
Question: Describe the differences between a batch gradient descent and a stochastic gradient descent.
Answer:
- Batch Gradient Descent: Computes the gradient using the entire dataset. It can be computationally expensive for large datasets but provides a stable path towards the minimum.
- Stochastic Gradient Descent (SGD): Computes the gradient using only a single data point or instance. It’s faster and can escape local minima, but the path to the global minimum is more erratic.
Question: Write a Python function to normalize (min-max scaling) a list of numbers to the range [0, 1].
Answer:
   def normalize(nums):
       min_val, max_val = min(nums), max(nums)
       return [(x - min_val) / (max_val - min_val) for x in nums]Code language: JavaScript (javascript)
Question: How does a Random Forest differ from a Decision Tree?
Answer: While both are tree-based algorithms, a Random Forest is an ensemble of Decision Trees. Here are key differences:
- Random Forests build multiple trees, usually with bootstrapped samples of data, and aggregate their predictions. They also randomly select a subset of features at each split.
- Decision Trees just build a single tree. They might be prone to overfitting, especially with deep trees, while Random Forests, through aggregation, generally yield better performance and are less prone to overfitting.
Question: Implement a Python function that calculates the cosine similarity between two vectors.
Answer: If you’re not using the skikit-learn library, your answer would look something like this:
   def cosine_similarity(v1, v2):
       dot_product = sum(i*j for i, j in zip(v1, v2))
       magnitude_v1 = sum(i*i for i in v1) ** 0.5
       magnitude_v2 = sum(i*i for i in v2) ** 0.5
       return dot_product / (magnitude_v1 * magnitude_v2)Code language: JavaScript (javascript)
Question: Describe the k-means clustering algorithm. When might it be used?
Answer: k-means is an iterative algorithm that partitions a dataset into ‘k’ distinct non-overlapping clusters based on distance (typically Euclidean). The algorithm assigns each data point to the nearest cluster centroid, then recalculates centroids, and repeats until convergence. It’s used for unsupervised clustering tasks when the number of clusters is known or can be estimated.
Question: Given a Pandas DataFrame df with a column ‘age’, write a Python function to bin this column into three age groups: ‘young’ (age < 30), ‘middle-aged’ (30 <= age < 60), and ‘senior’ (age >= 60).
Answer:
   import pandas as pd

   def bin_age(df):
       age_bins = [0, 30, 60, float('inf')]
       labels = ['young', 'middle-aged', 'senior']
       df['age_group'] = pd.cut(df['age'], bins=age_bins, labels=labels, right=False)
       return dfCode language: JavaScript (javascript)
Senior data science interview question
Question: Given a Pandas DataFrame df that contains missing values, write a Python function to impute missing values using the median for numerical columns and the mode for categorical columns.
Answer:
   import pandas as pd

   def impute_missing(df):
       for col in df.columns:
           if df[col].dtype == 'O':  # Categorical column
               mode = df[col].mode().iloc[0]
               df[col].fillna(mode, inplace=True)
           else:
               median = df[col].median()
               df[col].fillna(median, inplace=True)
       return dfCode language: PHP (php)
Question: How do you handle the challenge of data imbalance in classification tasks?
Answer: Data imbalance can lead to a model that’s biased towards the majority class. Techniques to handle it include:
- Resampling: Either oversampling the minority class or undersampling the majority.
- Using different evaluation metrics: Like F1-score, ROC-AUC instead of accuracy.
- Algorithms that handle imbalance: Like SMOTE or ADASYN for oversampling.
- Cost-sensitive learning: Where you assign higher penalties for misclassifying the minority class.
Question: Assuming you have access to popular machine learning Python libraries, how can you compute the Area Under the Receiver Operating Characteristic Curve (AUC-ROC), from two equally sized lists: one with true values and the other with predicted probabilities ?
Answer: This function exists in scikit-learn : sklearn.metrics.roc_auc_score.
Question: How do you determine the number of clusters to be used in a k-means clustering algorithm?
Answer:
- Elbow method: Plot the sum of squared distances for different numbers of clusters and find the “elbow” point.
- Silhouette method: Measures how similar an object is to its own cluster compared to other clusters.
- Gap statistic: Compares the total intra-cluster variation for different values of k with that of a random clustering.
Question: Write a Python function to perform a grid search over given hyperparameters for a Gradient Boosting Classifier, returning the best parameters.
Answer:
   from sklearn.ensemble import GradientBoostingClassifier
   from sklearn.model_selection import GridSearchCV

   def grid_search_gbc(X, y, param_grid):
       gbc = GradientBoostingClassifier()
       grid_search = GridSearchCV(gbc, param_grid, cv=5)
       grid_search.fit(X, y)
       return grid_search.best_params_Code language: JavaScript (javascript)
Question: What is the concept of “Transfer Learning”? Can you give an example scenario where it can be useful?
Answer: Transfer learning leverages knowledge from a previously trained model on a different but often related task. It’s beneficial when data for the new task is scarce. For instance, a model trained on a large dataset of generic images can be fine-tuned on a smaller dataset of medical images, transferring knowledge of features from general images to the specific task.
Question: Given a Pandas DataFrame df with a column ‘text_data’, write a Python function to tokenize this column into words and remove common stopwords.
Answer:
   import pandas as pd
   from nltk.corpus import stopwords
   from nltk.tokenize import word_tokenize

   def tokenize_remove_stopwords(df):
       stop_words = set(stopwords.words('english'))
       df['tokens'] = df['text_data'].apply(word_tokenize)
       df['tokens'] = df['tokens'].apply(lambda x: [word for word in x if word.lower() not in stop_words])
       return dfCode language: JavaScript (javascript)
Question: Discuss the trade-offs between a parametric model like Logistic Regression and a non-parametric model like k-Nearest Neighbors (k-NN).
Answer:
- Logistic Regression: Assumes a linear boundary between classes. It’s computationally efficient during prediction and requires less storage space. However, it might underfit if the relationship isn’t approximately linear.
- k-NN: Doesn’t assume any functional form for the decision boundary, making it more flexible. However, it requires storing the entire dataset and can be computationally intensive during prediction, especially with large datasets.
Question: Write a Python function to calculate the F1-score given a 2×2 confusion matrix.
Answer:
   def compute_f1_from_confusion_matrix(cm):
       true_positive = cm[1][1]
       false_positive = cm[0][1]
       false_negative = cm[1][0]
       precision = true_positive / (true_positive + false_positive)
       recall = true_positive / (true_positive + false_negative)
       f1_score = 2 * precision * recall / (precision + recall)
       return f1_scoreCode language: JavaScript (javascript)
More data science interview resources
For more guides on improving your knowledge of data science hiring, we have outlined helpful resources below:
1,000 Companies use CoderPad to Screen and Interview Developers


Best interview practices for data science roles
The data science interview process can be quite diverse, shaped by variables such as the specific role in question and the applicant’s level of expertise. To maximize the effectiveness of your data science interview questions, adhere to the following guidelines when engaging with potential hires:
- Develop technical questions that reflect genuine scenarios encountered within your organization – this strategy is not only more engaging for the candidate but also aids in determining how well their skills align with your team’s needs.
- Encourage an interactive environment by inviting the candidate to ask questions at any point during the discussion.
- Often times candidates are working with large data sets, so knowledge of big data processing platforms like Hadoop and Spark may be beneficial.
Furthermore, it is vital to uphold established interview norms during data science interviews – adapt the complexity of interview questions to match the candidate’s evolving level of expertise, provide prompt feedback on their status in the recruitment process, and allow sufficient opportunities for candidates to discuss the evaluation or delve deeper into the particulars of working with your team.