A Beginner’s Guide to JavaScript Debugging in Chrome
Did you know your web browser can do more than allow you to doom scroll 24-hour news services, find all your dev questions answered on StackOverflow, and discover hilarious pictures of cats?
It also works as an excellent tool for debugging your front-end JavaScript.
No longer will you have to rely on adding and deleting hundreds of console.log(“this is another debugging message”); to see what your code is doing. Instead, you can leverage tools like Chrome’s DevTools to see what your JavaScript is doing in real-time as you move around the screen. You can set breakpoints, view console logs, check variable values, and more.
We’re now going to walk you through the basics of running the debugging tool in your browser. We highly recommend completing the steps yourself as you run through them to get the most out of this guide.
How to access the debugger in Chrome
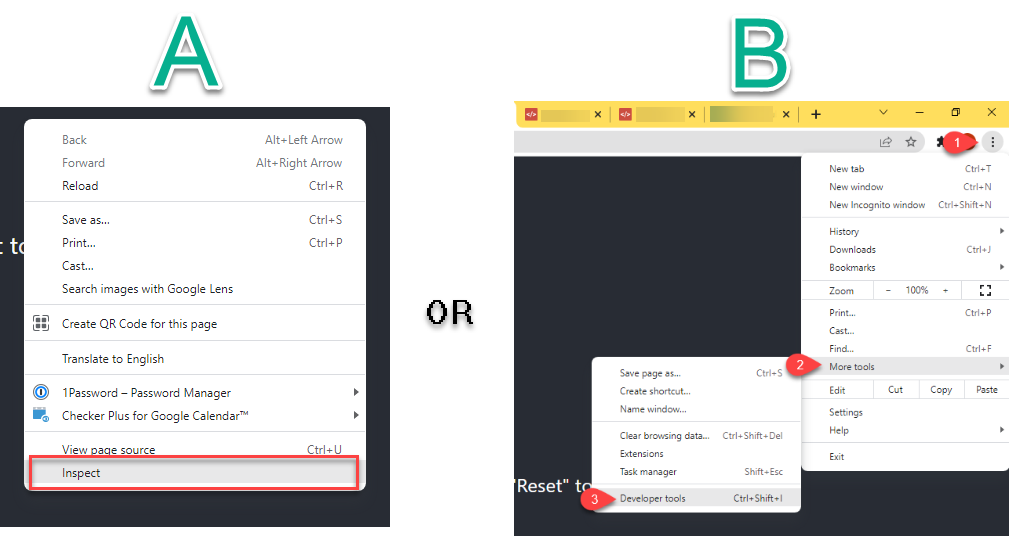
Accessing the debugger in Chrome is simple, and there are a few ways to do it:
- Right-click on the browser page you’d like to debug and select Inspect.
- Navigate to the browser menu, scroll down to More tools, and click on Developer tools.
- Use the keyboard shortcuts –
Ctrl Shift Jin Windows orCtrl Option Jin iOS.
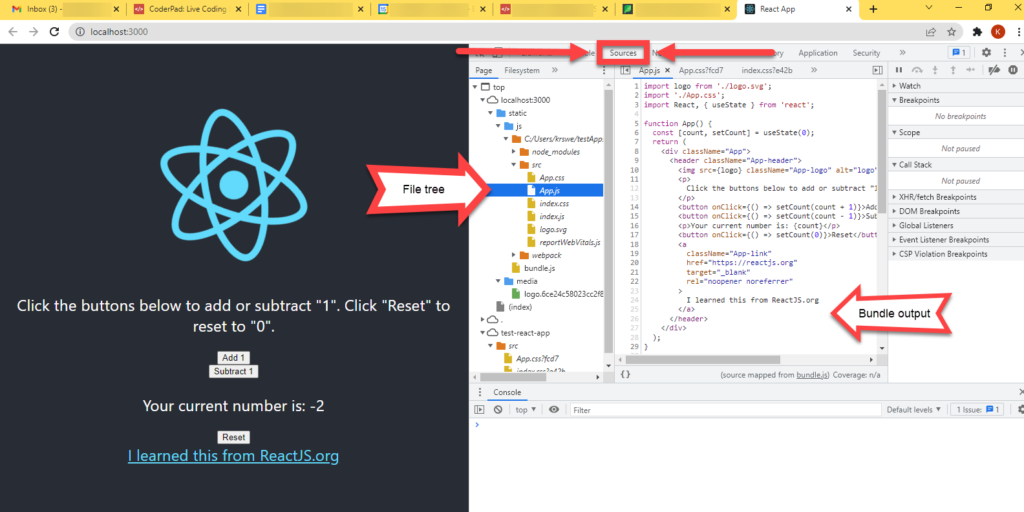
How to use the Sources tab
The Sources tab is where you view your source code/bundle output. It is the main panel you use for debugging. Here you can view your source files to set up your breakpoints, watch variables, and do the majority of your debugging. You can navigate through the file tree by clicking on the arrows in the file tree itself.
Breakpoints and debugging
Breakpoints allow you to pause the processing of your application to dive deeper into its current state. When the application is paused you can check the values of variables to see if they’re correct, you can dive into function calls to see that the appropriate logic is applied and that appropriate responses are returned.
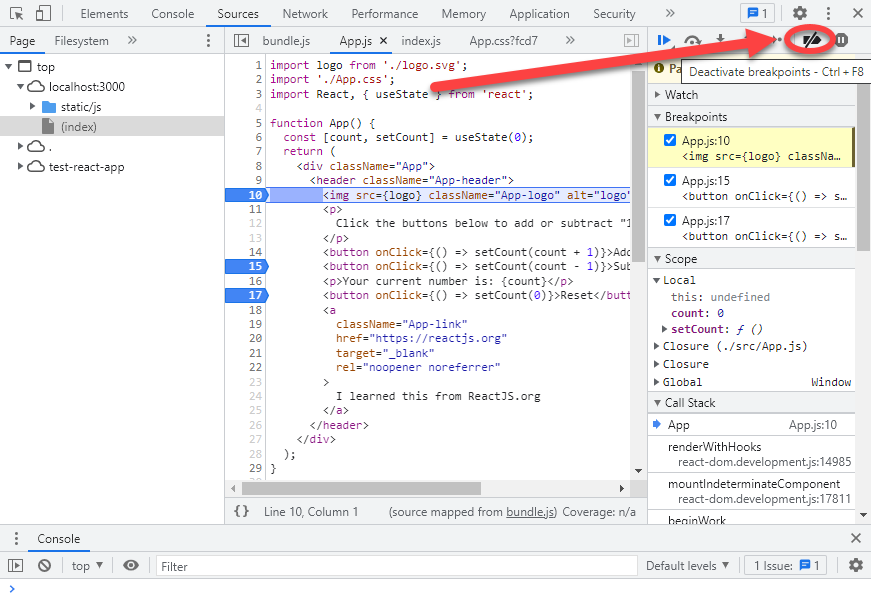
Add breakpoints by using either the debugger keyword which will pause the code at that point, or alternatively you can click on the line number at the piece of code where you want to establish the breakpoint.
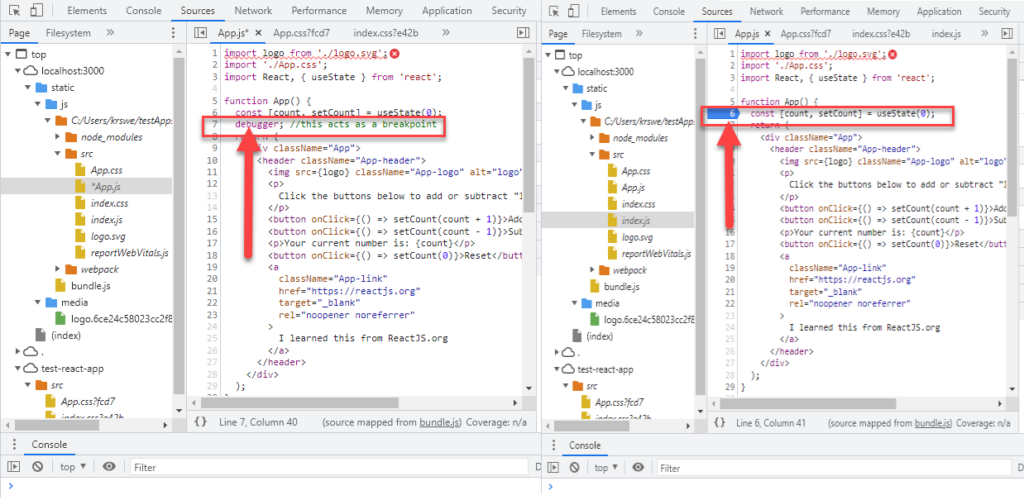
debugger keyword. Right: Using breakpoints.You can disable the breakpoint either by removing the debugger keyword or by clicking on the breakpoint you’d like to remove.
Alternatively, you can disable ALL breakpoints using this button in the top right corner.
Using the breakpoint toolbar
The breakpoint toolbar is the main way you’ll move through your code while you’re debugging your code. When the debugger pauses on a breakpoint that you have established, the toolbar will become available to you with the following actions:
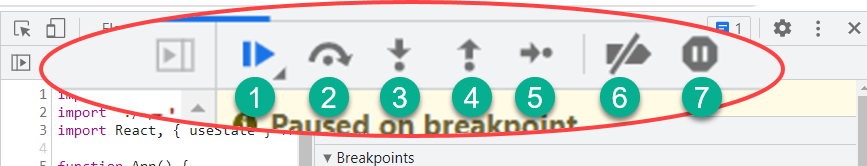
- Resume script execution: Continue to execute the code until the next breakpoint is hit
- Step over next function call: Skip over function calls and move to the next line of code.
- Step into next function call: Move into the next function call.
- Step out of current function: Move out of the current function into the caller’s logic
- Step: Move to the next piece of code.
- Deactivate breakpoints: Self-explanatory
- Pause on exceptions: Stop when an error is thrown
Conditional breakpoints and watching data
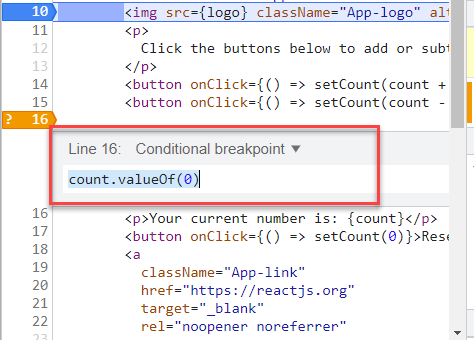
You can set boolean conditions that trigger breakpoints when they evaluate to True during the debugging process.
To do this, right-click on the breakpoint and select Edit breakpoint.
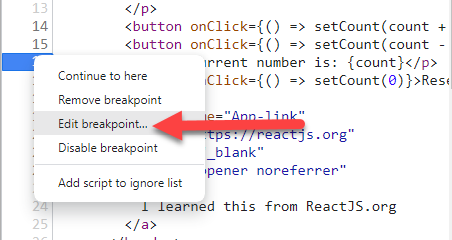
You’ll then see a box where you can enter the boolean condition to be evaluated.
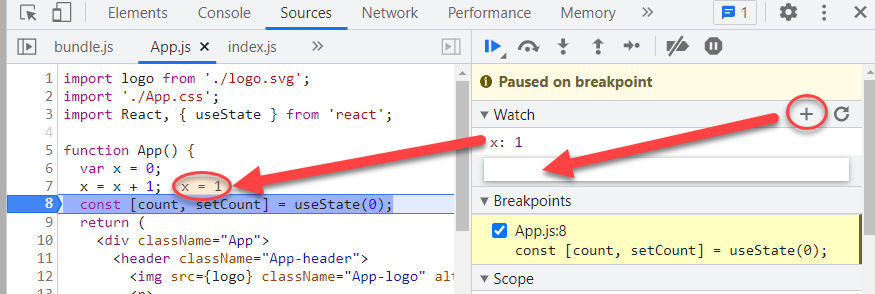
When inside the breakpoint you can also watch data to immediately see the results of a variable changing without writing a console.log() statement. Simply press the+ button in the Watch section and type the name of a variable.
Editing source code with Workspaces
Setting up a Workspace allows you to edit the source code from within the debugging tool in the browser. This way you don’t have to move between your regular IDE/text editor and the Chrome debugger everytime you want to make a change in the code to test or fix a bug.
To open up a workspace:
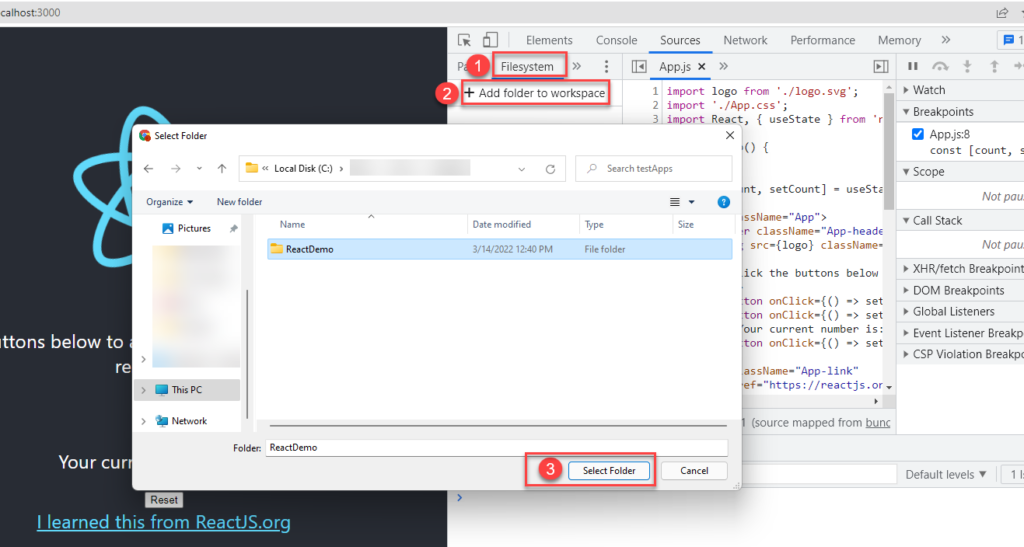
1) Click on the Filesystem tab on the left side of the debugger
2) Click on + Add folder to workspace
3) Select the source code you want to load into the workspace.
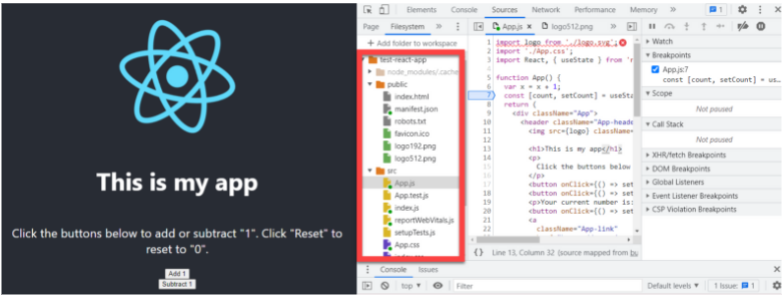
Once you select the folder and grant file access to the debugger, you’ll see all your source code with colored icons representing the different file types. Any changes you make in the code in the debugger window will be reflected in the source file once you save it using Ctrl S for Windows or Command S for Mac.
You can edit the HTML and CSS files directly in the workspace; however, if you want the benefit of doing it with the UI help of the Elements tab, there is an excellent article on the Chrome Developers page on how to do just that.
Congratulations, you should now be able to do some basic debugging on your JavaScript application, including setting up breakpoints to inspect your code during runtime and setting up workspaces so you can edit your code directly from your browser! If you want more info on all the fantastic things the Chrome debugger can do, check out their documentation here.