An Intro to the Code Property Graph: Learn How to Leverage Graph-Oriented Databases for Source Code Analysis

Software security is a massive and fast-growing industry. The vast majority of developers face pressure to deliver a product on time.
Unfortunately, ensuring a source code’s security often comes after its functionality is developed. It’s hard and takes time to inspect and maintain extensive source codes. More specifically, it is not trivial to ensure dependencies, avoid redundancy, assess the coherence of control flow and keep consistency on code conventions in terms of structure or syntax.
Although standard source code analysis techniques may handle basic syntax mistakes and code vulnerabilities, there are still uncaught problems. Consequently, most software products are still subject to coding errors and lack security.
The Code Property Graph (CPG) is a major innovation with the potential to change that.
“The Code Property Graph (CPG) is a break-through innovation in static code analysis”
Shiftleft.io
Graph-oriented databases are increasingly used for storing complex and intricate data. They allow automated, fast and potent queries. Their structure makes them human-readable and easily traversable.
It would be tremendously advantageous to transform a source code into an organized and queryable dataset representing how the program works in a graph database. With this method, navigating through source code and inspecting its deep structure would be straightforward.
That is where the Code Property Graph (CPG) comes into place.
What is a graph database?
Graph databases are members of the NoSQL databases. They use nodes, edges and properties to store data in a graph structure. Nodes represent entities to store. They are related to each other through edges. Additional information can be added about relationships or entities with properties.
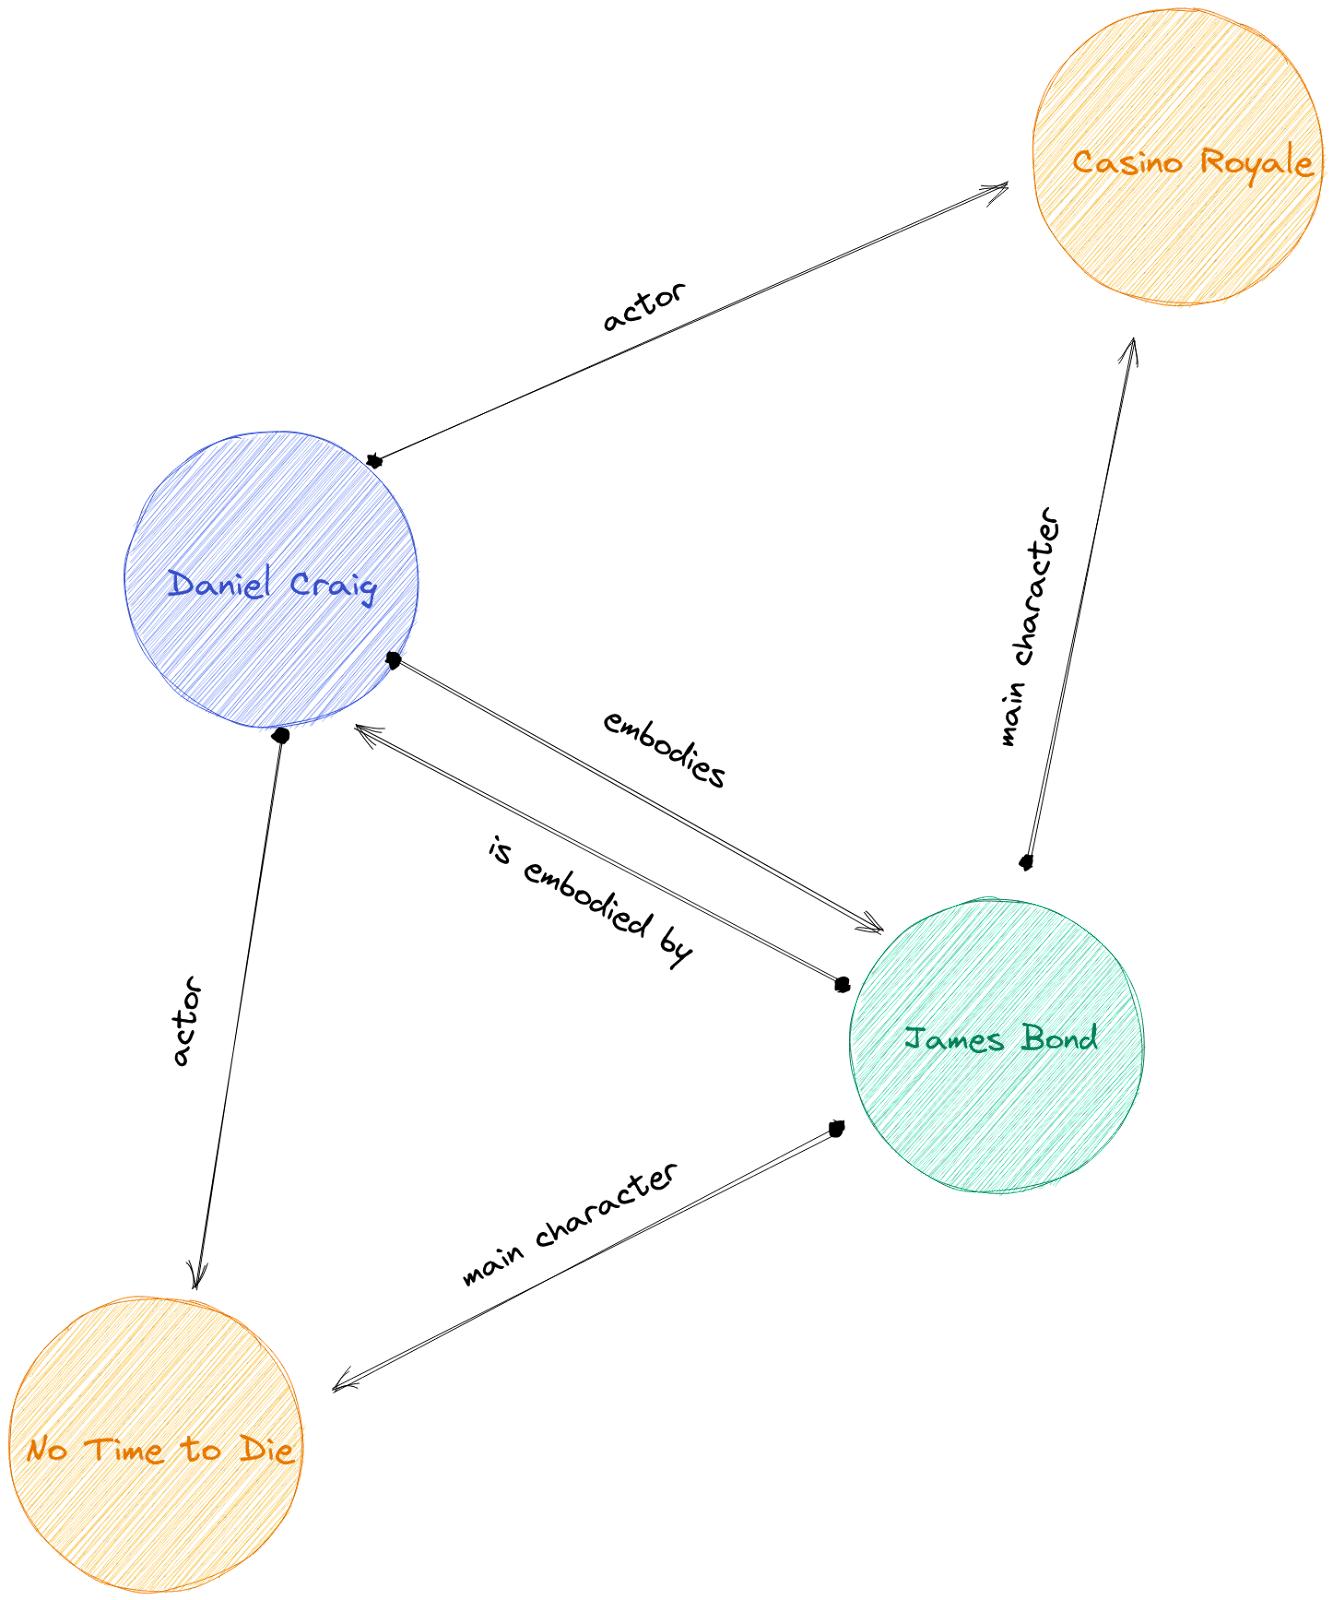
Let’s illustrate this concept with a dude named Bond, James Bond. James Bond is a character represented by a node (green node in figure 1). He is the main character of some movies. Nodes are used to symbolize the movies as well. The edges between characters and movies indicate the movie’s character relevance. Then comes the actor, Daniel Craig, another node. He is connected to the movies because he appears in them. He also embodies James Bond.
There are many different ways of organizing data into a graph. We could have removed the “James Bond” node and specified it as a property of the “actor” edge. It would have remained accurate. The way we choose to organize data into a graph is called Ontology, and this is a field of research in itself. Once we fill the ontology with data, the whole graph structure makes a knowledge graph.
A natural way to store data…
The primary benefit of graph databases is that the way data is stored is very logical and straightforward to comprehend from a human standpoint. Even those unfamiliar with databases may quickly comprehend held information and identify details such as an isolated node.
…In a highly flexible manner…
Furthermore, graph databases are highly flexible. It is unnecessary to alter the data structure or add additional tables and keys, as with SQL-like databases, to add new types of nodes or information about objects. This is especially true when referring to data that are densely connected.
… without affecting querying speed.
Graph databases directly store relationships, so when querying, there is no need to compute these relationships, just to navigate through the graph. Consequently, query speed does not slow with the amount of data, nor with the intricate complexity of information.
Graph databases excel at storing intricate data.
Data relationships are frequently crucial for comprehending the data itself. Graph databases become relevant when there are many links between the data. This is one of the reasons why graph databases are commonly used for social network analysis or consumer preference research. They are helpful in manufacturing for identifying crucial dependencies as well as in banking for detecting fraud. Last but not least, they can be rather valuable in any circumstances involving elaborate and complexly ordered data, which is typically the case in real-world applications.
What about source code?
In software systems, many types of information are frequently intertwined in complex ways, making it challenging to comprehend how the entire program is laid out. Imagine being able to turn the jumble of all source code into a limpid graph that you can explore. Here comes the Code Property Graph!
What is a Code Property Graph (CPG)?
You need three sub-graphs to capture all mandatory entities and relationships to describe how a program works: Abstract Syntax Tree (AST), Control Flow Graph (CFG) and Program Dependence Graph (PDG). A CPG is composed of these three sub-graphs.
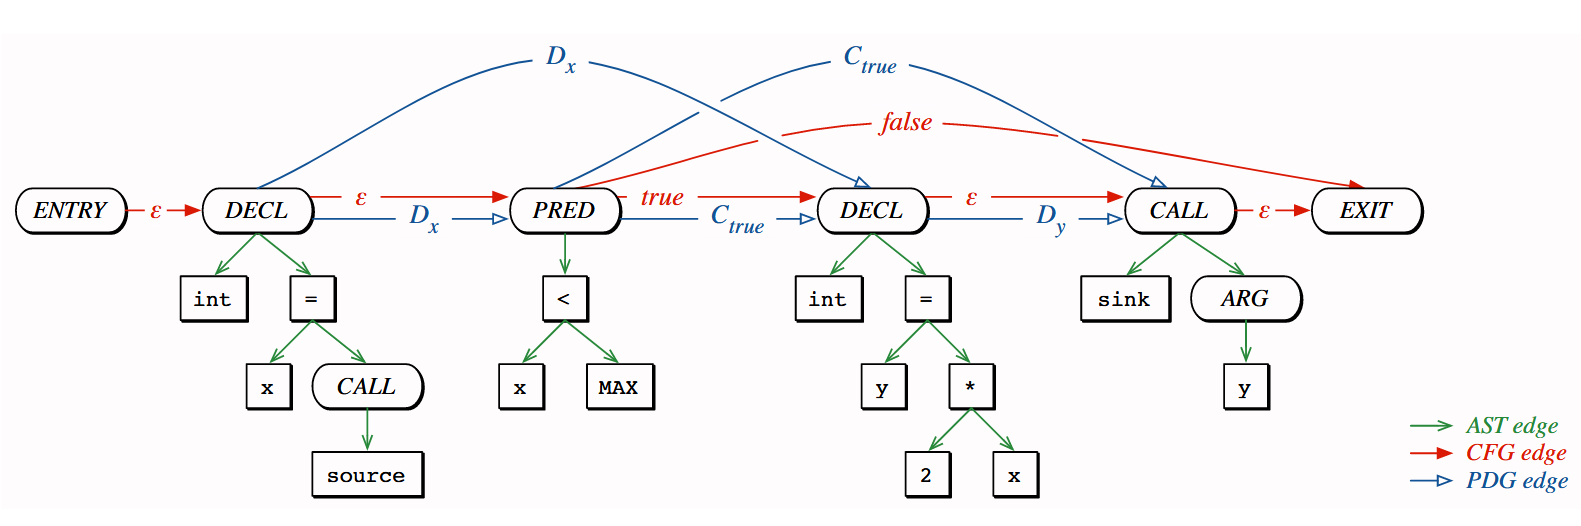
Let’s illustrate what is contained in these graphs using the example provided by F. Yamaguchi et al. in their seminal paper Modeling and Discovering Vulnerabilities with Code Property Graphs.
The authors took the following code sample as example:
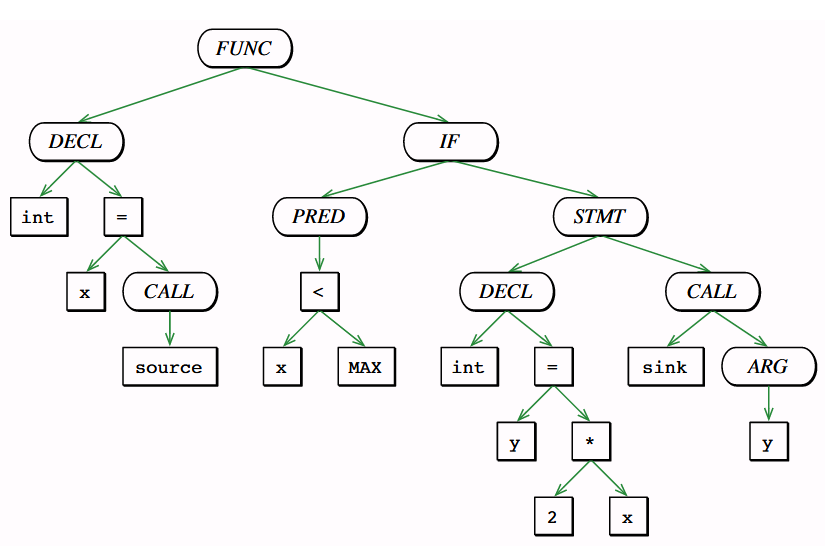
void foo(){ int x=source(); if (x<MAX) { int y = 2 * x; sink(y); }}Code language: HTML, XML (xml)Abstract Syntax Tree (AST)
The AST encodes how statements and expressions are nested to produce a program. Inner nodes denote operators, leaf nodes denote operands, and edges specify container and content relationships.
For instance, the tree branch on the left of figure 2 tells us that the main function contains a declaration of a variable of type int. This x variable is assigned to the result of the source function.
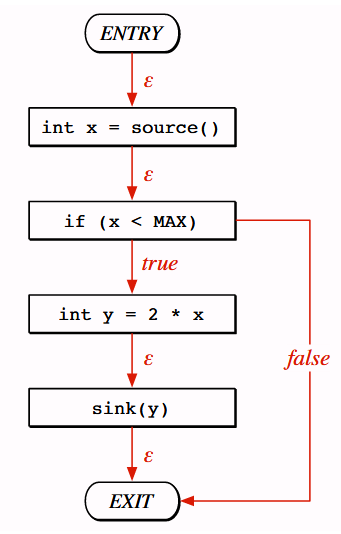
Control Flow Graph (CFG)
The CFG describes the order in which code statements are executed. It also shows the conditions that must be met for a particular execution path.
Nodes represent statements or predicates, and edges denote the paths the program can traverse. When nodes’ outputs are unique, edges are labeled with an ε. Edges related to nodes with two possible outcomes are labeled with True or False.
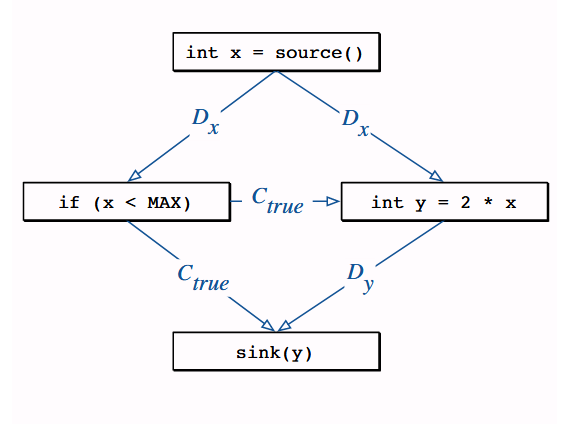
Program Dependence Graph
The PDG shows dependencies among statements and predicates.
There are two types of edges: Data dependence edges (denoted with a D) and control dependence edges (denoted with a C). Data dependence edges indicate when a node’s outcome affects a variable in another node. Control dependence edges, however, show the influence of predicates on the value of a variable.
For instance, with the PDG in figure 4, we see that the predicate if (x<MAX) must be true for reaching the sink function. Moreover, the sink(y) node also depends on the declaration of the y variable.
CPG = AST+CFG+PDG
A CPG is the combination of the three sub-graphs (Figure 5). The key insight for combining the graphs is that statements and predicates have a node in each sub-graph.
Everything here appears quite clear-cut and trivial. But CPG really shines in more extensive and complex programs. The final section of this article will include further CPG usage examples. But let’s look at how we might generate a CPG from code for the time being.
The CPG toolkit and an end-to-end example:
We now know the meaning of a graph database and how CPG may be used to visualize a program as a graph. Let’s now look at several tools for creating and exploring CPG on your own.
Use Joern to generate a CPG
Joern is a platform that allows CPG generation from a wide range of languages. It does, in fact, permit activities other than CPG production. With Joern, various source code evaluations can be carried out. It is a complete project with excellent documentation. If you’re interested in learning more, I recommend you to check out the GitHub project.
Install Joern
The first step is ensuring Joern is correctly installed (see here). Installation can be more challenging if you are using Windows (like me). Here are the steps to take if that is the case:
- Java Development Kit (JDK) is required. You can download it from here.
- Clone the Joern repository
clone https://github.com/joernio/joern.gitCode language: PHP (php)- Install the Scala build tool (sbt).
The easiest way to install sbt on Windows is to use the Chocolatey package manager.
choco install sbt- Build Joern with sbt by running the following command while you are inside the Joern folder:
sbt stage- Finally, install Joern through the interactive interface and follow the instructions.
joern-install.sh --interactiveCode language: CSS (css)Once you have Joern installed, we can continue our journey!
The two main ways to use Joern are:
1. through the interactive shell, by launching the joern command. This is adapted for performing code analysis directly with Joern.
2. with the command line functions. In this tutorial, we’ll use the command line tools because they are more straightforward and sufficient to parse the code and generate a CPG.
Parse the code
The first step is to parse the code. For doing so, just run the command:
joern-parse project_path --output cpg_file_namewith project_path being the absolute path of the code project folder you want to parse, and cpg_file_name being the absolute name of the file containing the CPG that will be created. Joern will parse all files in the project_path folder interpreted as code. Joern performs an automatic language detection based on file extension, but you can specify a language with the --language argument if needed.
We’re making good progress, but the created CPG file is not yet readable outside of Joern.
Export CPG to a readable format
The second step is to export the CPG to a reusable format. Joern is highly compatible with Neo4j, one of the most popular graph database management systems. Let’s export our CPG to a Neo4j-compatible format.
joern-export cpg_file_name --out output_folder --repr all --format neo4jcsvCode language: JavaScript (javascript)with cpg_file_name being the absolute name of the file generated during the parsing step, and output_folder being the absolute path of the folder where you want the CPG to be stored. The --repr option is for selecting the graph representation you want to extract. The --format argument specifies the format of extraction.
Now we get many CSV files. Some contain information about nodes and edges of our CPG, and others hold the Cypher code (the language used by Neo4j) for importing the data into a Neo4j graph database.
CPG to Neo4j
Visualization and navigation through a CPG enable us to fully utilize its capabilities and provide a global view of the source code used to create it. Let’s take a look at Neo4j, a tool for navigating and visualizing graph databases.
A brief introduction to Neo4j
You will need Neo4j for the rest of the tutorial. Here is where you download it: download Neo4j. Neo4j’s desktop version is free, but you’ll need to fill out a form. Just follow the steps. Once you have Neo4j, open it and create a new project.
Neo4j Desktop is composed of several apps. The two main apps useful to be aware of are Browser and Bloom. The Browser is made to send cypher queries to the graph database to fetch data or create nodes and relationships. Bloom is an exploration and visualization tool on which you can pre-write complex queries and build views on your database. Even non-database experts can navigate through the graph with Bloom. Only a tiny portion of the possibilities will be covered here. For more information, visit the neo4j website.
CPG import
Now we want to import our CPG to Neo4j. We can run the cypher pieces of code in the Neo4j Browser app, but I find it clumsy. I favour automating it. I wrote a python script for doing so that you can find here. You just have to run the main file after modifying paths and database names on the configuration file to correspond to your project and the setup on your machine.
So now, if everything goes well, you may have your CPG into Neo4j. Let’s enjoy the exploration!
CPG exploration with Bloom
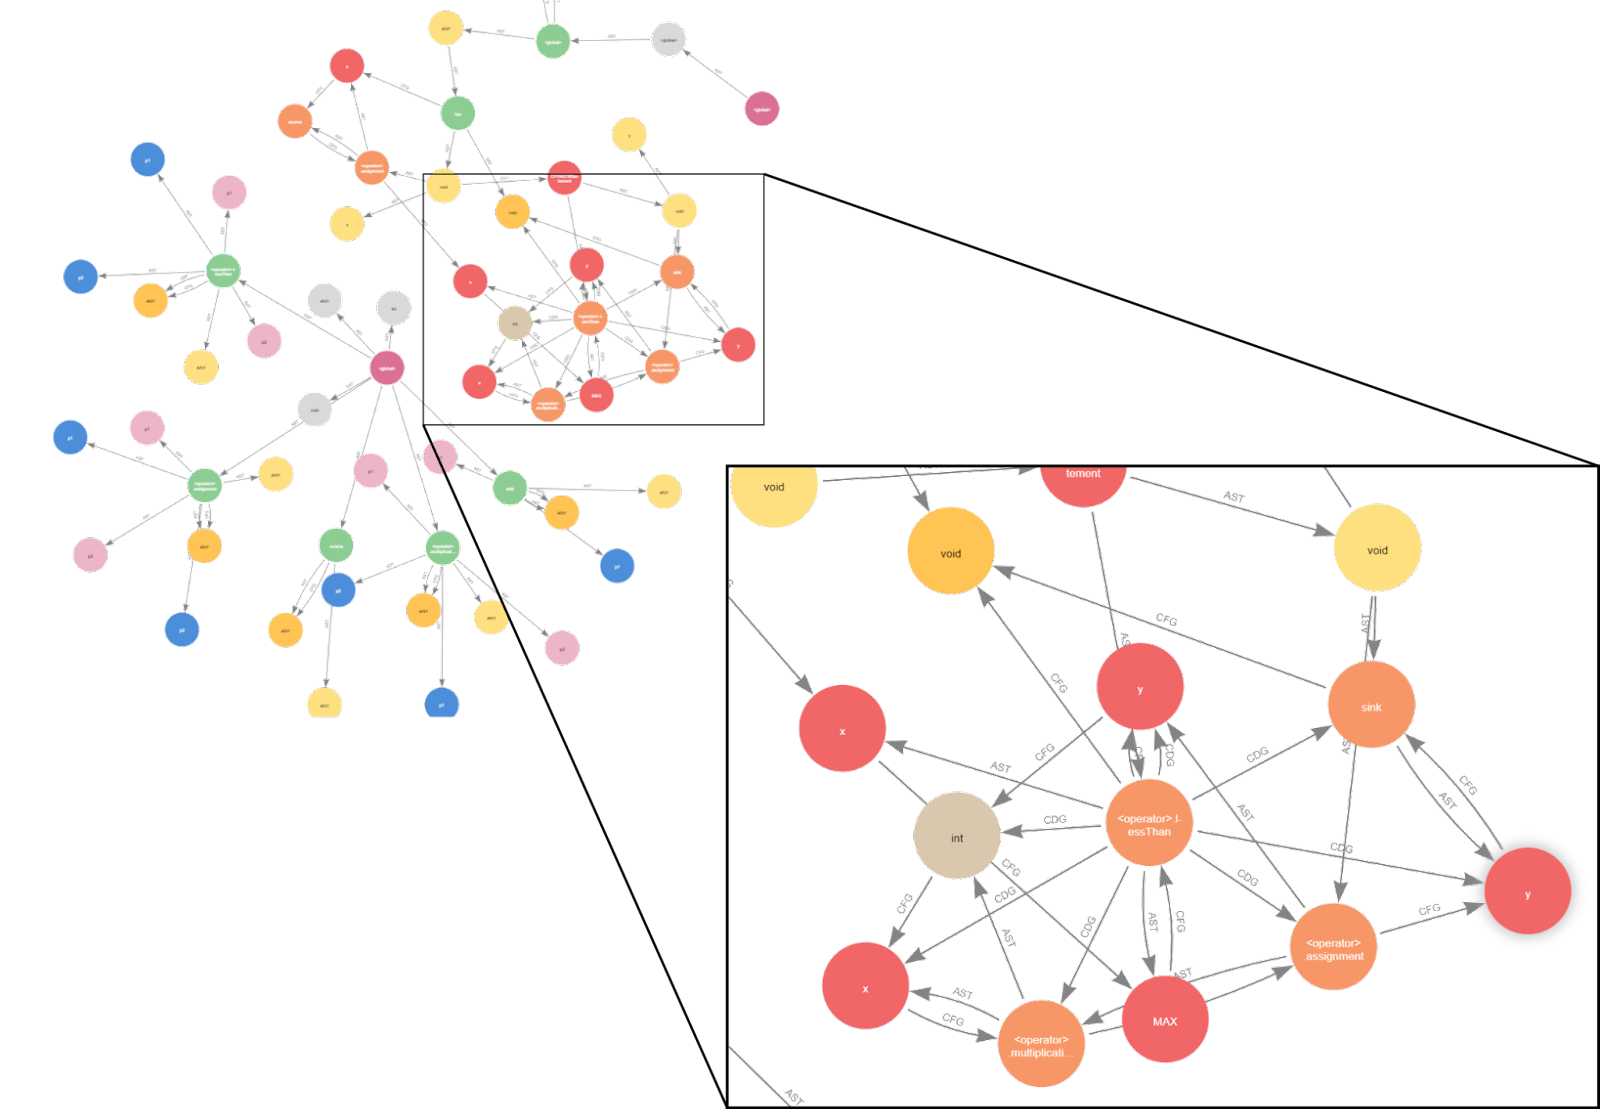
On figure 6, you can see the bloom view of the CPG we generated with Joern and imported on Neo4j. First, CPG generation has been enriched since the Yamaguchi et al. paper (2014), and many more elements are present on the graph now.
Here we only show CPG edges (AST, CFG, PDG) and related nodes. But if you try it by yourself, you will notice that many nodes and edges we didn’t explain before are present.
Indeed, all possible information about the code, the underlying methods, the data types, the namespace etc. are all accessible and queryable. The code parsing is made with compilation at a lower level than just what we wrote in our source file. So the information at our disposal is wealthy.
All available specifications are well documented and explained on the joern specification page. If you want to go deeper into the use and understanding of CPG, this will become your new bible.
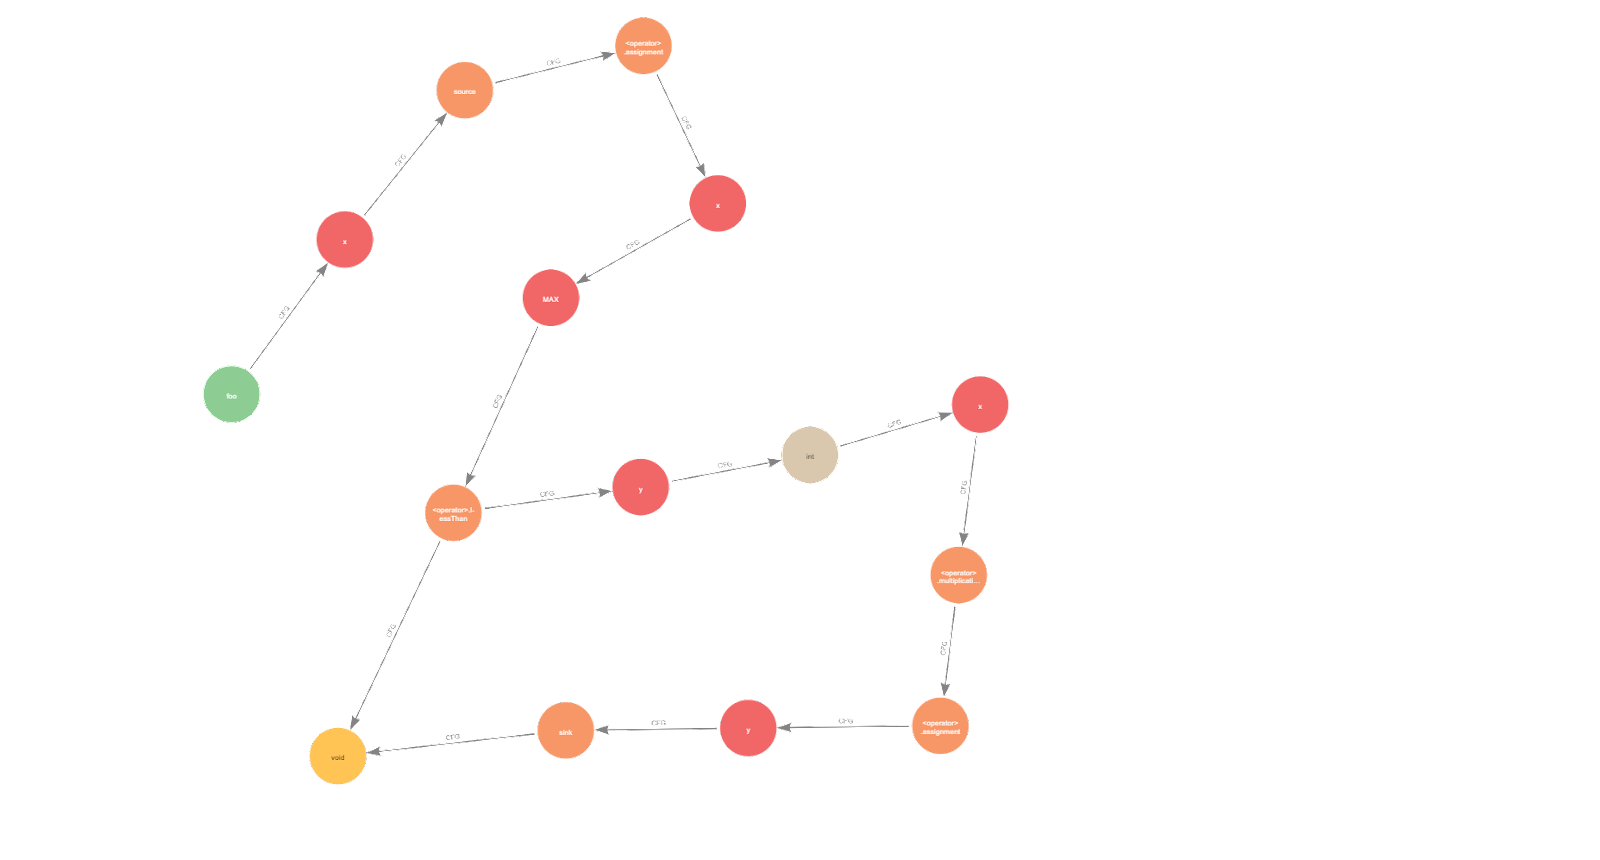
By cleaning the view, we can highlight what we are interested in. For instance, in figure 7, we can see the control flow from the call of foo() (the green node) to the return of the void function (the yellow node). An intersection arises when x is compared to MAX, as shown in figure 3 with the CFG first definition.
We will not go deeper in the CPG exploration here because this article is just an introduction. The point here is to give you an overview of CPG and the tools for manipulating it. However, I sincerely encourage you to generate CPG on your own code.
Massive CPG may initially seem grueling to explore, but with tools such as Neo4j Bloom, you can quickly isolate a node and explore step by step which nodes are related to it or what kind of relationships they have. You can run more elaborate and sophisticated searches, such as “what is the shortest path between two nodes?” or “what nodes are connected to these two variables?”.
Let’s go a step further: Concrete applications of CPG
So far, we’ve explained that CPG is a graph representation of source code. We learned how to generate it using Joern, and how to explore it with Neo4j. Even with these basic examples, you should have a hint at the power of CPG as a queriable source code.
The real strength of CPG comes when queries are automated to spot patterns and clues you cannot see by reading your code only.
But is CPG used in the real world? And what exactly is done with it? What are the concrete applications of CPG? Some companies already use some, others are still at the research step, and more is to be discovered.
Code security: the primary application of CPG
CPG was brought to the forefront by Yamaguchi et al. in 2014. They presented it as the new tool for code security analysis. But what kind of vulnerabilities can we spot with CPG?
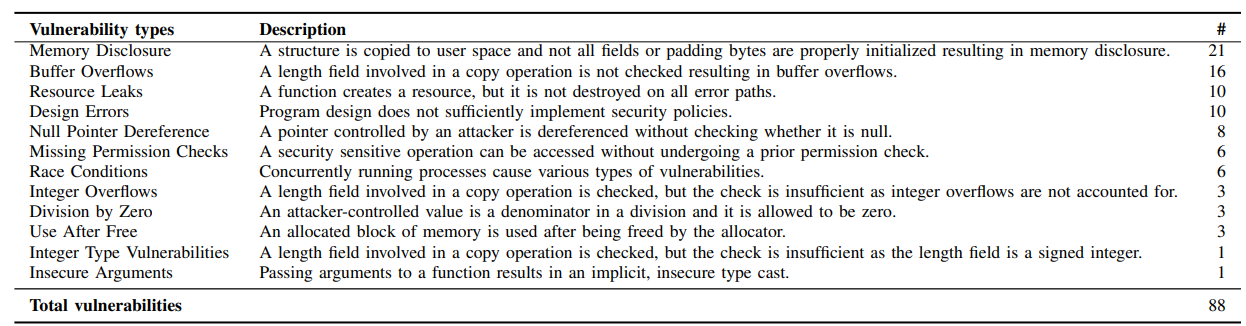
The combination of AST, CFG and PDG allowed the detection of 10 out of 12 vulnerabilities in the Linux kernel in 2012. Only design errors and race conditions vulnerability types were hard to address with CPG traversal.
Even if other existing tools could identify vulnerabilities, the fundamental strength of CPG was that all vulnerabilities could be handled by a sole code representation.
Moreover, the size and complexity of the source code did not impact the performance of the research. This means we had a tool for mining and processing a considerable amount of source code. In essence, Code Property Graph enabled large-scale code analysis.
Nearly ten years later, Joern is an all-encompassing open-source project that anyone can use. Specialized code security companies like ShiftLeft use this backend technology to provide strong security solutions.
CPG is not very well known or widespread. Despite the genuine potential, the CPG expected outbreak uncannily materialized only within the recent past. Notwithstanding, applications are being developed that use the capabilities of graph-oriented databases to analyse source code from a fresh perspective.
Other potential applications
Let’s investigate possible CPG applications, especially those that result from converging CPG with graph data science. In my perspective, this is the groundbreaking combination.
Graph data science is a well-advanced field aiming to analyze the structure and relationships in data. Many algorithms can be used to do so. Here are some of the well-known and their related applications with CPG.
Pathfinding and search
Graph search algorithms explore a graph for general discovery or explicit search. Commonly, these algorithms serve as core components of other algorithms. They are also used for vulnerability discovery.
Centrality/Importance
The significance of nodes in a graph is assessed using Centrality/Importance methods.
Significance can mean that a node:
- has a lot of direct relationships with other nodes
- is transitively connected to other important nodes
- can reach other nodes with fewer hops
- sits on the shortest path of a lot of pairs of nodes
These methods could be used to locate unanticipated, crucial code fragments. This might aid developers in deciding which areas of the code to restructure or improve first.
Community detection
Community detection algorithms evaluate how groups of nodes are clustered or partitioned. Imagine using these algorithms to identify parts of code that could be encapsulated into modules, increasing the security, maintainability and robustness of a whole project.
Link prediction
Link prediction algorithms estimate the likelihood of nodes forming a future relationship. By predicting the link between the CPG of different codes, you should be able to anticipate code compatibility and how modules will dialogue together.
Imagine being able to choose, using this method, the most suitable library to use in your project.
Similarity detection
Similarity algorithms are used to determine the similarity between nodes or groups of nodes based on their neighbours or their properties.
Performing similarity detection on large CPG could allow to spot opportunities for refactorization and, as a result, avoid redundancy. Performing on diverse projects could also help companies identify potential connections between teams working on the same types of software.
What will be next?
CPG can be used as a tool that allows programs to understand and manipulate programing language semantically.
I presented some simple applications, but imagine creating a CPG on thousands of projects, comparing them, and identifying patterns and structures.
In today’s world, almost everything runs on code at some point–companies, supply chains, and communication systems. The amount of information available is basically endless. Being able to mine and parse these treasures into usable databases would open the door to unprecedented upheaval.
Recent research employs graph representations of source code to do semantic code comprehension (e.g., Neural Code Comprehension: A Learnable Representation of Code Semantics. Ben-Nun, T., Jakobovits, A.S. and Hoefler, T., 2018.). Source code in the form of a queriable data set is indeed increasingly used to train deep learning models for code comprehension.
CPGs are the present and future of neural code understanding. Several companies are already developing tools to comprehend, change, and produce programs. Products like CodeGuru for Amazon or Copilot for Microsoft use graphical representations of source code in their processes.
However, code comprehension is relatively young compared to analogous technologies such as natural language processing. I firmly believe that CPG, more broadly, source code representations in graph form, has an even brighter future. More surprising and breakthrough inventions will result from this technology.
This article was written by Simon Bastide: I’m a data scientist with a Ph.D. in human movement sciences. I’m genuinely fascinated by understanding the world through data, and I like to employ my skills to help people act wisely. I’m always pleased to discuss. Contact me on LinkedIn!