2 Interview Questions for Vetting Data Science Candidates

As artificial intelligence and machine learning technologies continue to boom, the search for proficient data scientists has become increasingly difficult as you try to evaluate – or even locate – the ideal candidate.
This translates to a potential increase in the time and financial resources expended in recruiting for these roles. To avoid squandering both time and money, it is critical to ensure that you’re selecting the right data scientist for your organization. Repeating the hiring process multiple times is undeniably an unwise utilization of both time and resources.
Therefore, if you’re intent on hiring the best data scientist for your team, a thoughtful evaluation of the appropriate data science competencies is essential.
Most importantly, it’s vital to scrutinize both their statistical analysis capabilities and their expertise in data management and machine learning as those skills pertain to your team’s needs. Depending on your hiring criteria, this might entail an assessment of specialized competencies such as proficiency in Python or R, or more general skills like data visualization and predictive modeling.
Equally important – given your company’s data architecture, databases, and cloud storage – is a deep understanding of big data technologies, data mining techniques, and knowledge of data privacy and ethics.
One of the superior methods to gauge these crucial skills in prospective employees is through the initiation of collaborative data projects or case studies within a realistic environment. That means devising insightful technical interview questions is a crucial aspect of the interview procedure, warranting particular focus.
In this post, we will delve into two data science interview questions that can serve as tools to gauge the aptitude of your candidates. Although initially set in specific analytical frameworks, you can modify them to align with your specific technical requirements – the principles are broad enough that the exact toolkit is not important.
🔖 Related resource: Jupyter Notebook for realistic data science interviews
Question 1: Iris Exploratory Analysis
Context
The Iris dataset is a well known, heavily studied dataset hosted for public use by the UCI Machine Learning Repository.
The dataset includes three iris species with 50 samples each as well as some properties about each flower. One flower species is linearly separable from the other two, but the other two are not linearly separable from each other.
The columns in this dataset are:
idsepal_length_cmsepal_width_cmpetal_length_cmpetal_width_cmclassthis is the species of Iris
The sample CSV data looks like this:
sepal_length_cm,sepal_width_cm,petal_length_cm,petal_width_cm,class
5.1,3.5,1.4,0.2,Iris-setosa
7.0,3.2,4.7,1.4,Iris-versicolor
5.8,2.7,5.1,1.9,Iris-virginicaCode language: CSS (css)
Directions
Using any analysis method you choose, build either a classifier or produce a data visualization, that shows how the available data can be leveraged to predict the species of Iris.
Initial cell contents
Use this starter code to get started with accessing the Iris dataset in this pad. Feel free to use either Pandas or Native Python for your work.
You may install additional packages by using pip in this Notebook’s terminal.
import pandas as pd
import pprint

# Result as pandas data frame

result_df = pd.read_csv('iris.csv')

# Preview results output as a data frame

result_df.head()

# Result as pythonic list of dictionaries

result = result_df.where(pd.notnull(result_df), None).to_dict('records')

# Preview results output as a native list of dictionaries

pprint.pprint([record for record in result])Code language: Python (python)
Success criteria
At minimum, a candidate should be able to conduct a basic analysis showing that they explored the data and found a way to separate the unique characteristics of each flower from the other.
For example:
- Does one species of iris have longer petals than the other?
- Can the candidate pose questions about the dataset and explore the data for answers to those questions?
- Are the methods the candidate uses to explore the data reasonable? This question primarily requires some basic analysis and data visualization. If a candidate starts off with a more complex approach, there may be a missed opportunity for fast, early lessons from the data, aka “low-hanging fruit.”
- Can the candidate support any observations with plots?
- How does the candidate form inferences from the data and how well does that candidate apply statistics to defend their inferences?
Try out this question
🧑💻 You can access this question in a CoderPad sandbox here.Question 2: Forecasting Future Grocery Store Sales
Context
This example question uses one of the Getting Started competitions on Kaggle. The goal is to forecast future store sales for Corporación Favorita, a large Ecuadorian-based grocery retailer.
Data
train.csv: The training data, comprising time series of features store_nbr, family, and on promotion as well as the target salestest.csv: The test data, having the same features as the training data but starts after the ending date of train data and for 15 dates. One has to predict the target sales for the dates in this filestores.csv: This has some stores metadata including city, state, type, and cluster (grouping of similar stores)oil.csv: This has oil price data as Ecuador economy is susceptible to volatility of oil marketholidays_events.csv: This has data on holidays and events in Ecuador
Directions
- You are expected to do at least one completed time series analysis that predicts future sales.
- You are expected to show any data transformations and exploratory analysis.
- You have full flexibility to use the provided data as desired, but at minimum the date and sales numbers need to be used.
Initial cell contents
Please review the context and data overview in the Instructions panel in this pad to gain a basic understanding of the available data and this exercise.
# Following code loads useful libraries

# Useful for out of the box time series function libraries
install.packages('fpp3')
library(fpp3)

library(tsibble)
library(tsibbledata)
library(tidyverse)
library(ggplot2)Code language: R (r)
# Reading all the input datasets into memory
df_train <- read_csv("/home/coderpad/app/store sales files/train.csv",show_col_types = FALSE) %>%
mutate(store_nbr = as.factor(store_nbr))
df_test <- read_csv("/home/coderpad/app/store sales files/test.csv",show_col_types = FALSE) %>%
mutate(store_nbr = as.factor(store_nbr))
df_stores <- read_csv("/home/coderpad/app/store sales files/stores.csv",show_col_types = FALSE) %>%
mutate(store_nbr = as.factor(store_nbr))
df_transactions <- read_csv("/home/coderpad/app/store sales files/transactions.csv",show_col_types = FALSE)
df_oil <- read_csv("/home/coderpad/app/store sales files/oil.csv",show_col_types = FALSE)
df_holidays_events <- read_csv("/home/coderpad/app/store sales files/holidays_events.csv",show_col_types = FALSE)Code language: R (r)# Show training data
head(df_train)Code language: R (r)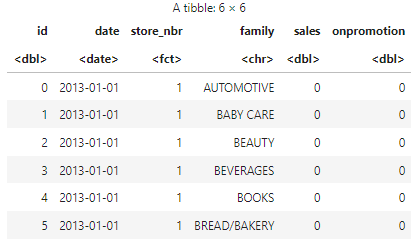
# Example visual of total daily sales

# Converting data frame into a tsbibble object
train_tsbl <- df_train %>%
  as_tsibble(key = c(store_nbr, family), index = date) %>%
  fill_gaps(.full = TRUE)

train_tsbl[is.na(train_tsbl)] <- 0

# aggregate data by stores
train_tsbl <- train_tsbl %>%
  aggregate_key(store_nbr, sales = sum(sales))

options(repr.plot.width = 18, repr.plot.height = 6)
train_tsbl %>%
  filter(is_aggregated(store_nbr)) %>%
  ggplot(aes(x = date, y = sales)) +
   geom_line(aes(group=1), colour="dark green") +
  labs(title = "Total Sales")Code language: R (r)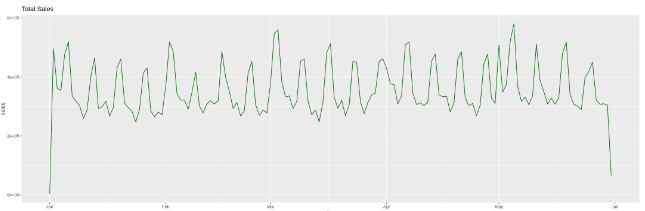
Success criteria
At minimum, a candidate should be able to conduct a basic time series analysis showing that they explored the data, transformed it appropriately for a time series analysis, considered a confounding factor like seasonality, and interpreted results in a reasonably accurate way.
For example:
- Does the candidate know to address auto-correlated data?
- Does the candidate explore the data to find any necessary transformations/clean up needed ahead of the analysis?
- Can the candidate identify seasonal patterns among store sales?
- Is the candidate able to justify their analysis approach and conclusions?
🧑💻 You can access this question in a CoderPad sandbox here.
Conclusion
Assessing data scientists involves more than just scrutinizing their technical skills. To more accurately determine their fit for your team, we recommend consulting the supplementary interview guides found in the Related Posts section below.
Some parts of this blog post were written with the assistance of ChatGPT.